 Explainable AI (XAI) in Production – SHAP, LIME, and Interpretability Techniques
Ensure transparency, trust, and accountability in model predictions, especially in regulated or high-stakes domains. Tools like SHAP and LIME help diagnose model behavior, debug errors, and support compliance by making black-box models interpretable.
We should learn Explainable AI (XAI) to ensure transparency, trust, and accountability in model predictions, especially in regulated or high-stakes domains. Tools like SHAP and LIME help diagnose model behavior, debug errors, and support compliance by making black-box models interpretable.
📚 Key Learnings
- Understand Explainable AI (XAI)
- Learn how SHAP and LIME provide insights into model predictions
- Integrate XAI into production APIs, dashboards, or monitoring flows
- Support compliance, debugging, and trust using interpretable outputs
- Understand the importance of model interpretability in real-world ML deployments
🧠 Learn here
Explainable AI (XAI)
Explainable AI (XAI) refers to methods and techniques that help interpret and understand the decisions made by machine learning (ML) models. As ML systems are increasingly used in critical applications (healthcare, finance, legal, etc.), it becomes vital to understand how and why models make certain predictions. This ensures transparency, trust, and regulatory compliance.
Objectives of XAI:
- Improve transparency in model predictions
- Build user trust by providing human-understandable explanations
- Enable debugging and improvement of ML models
- Ensure regulatory compliance (e.g., GDPR, HIPAA)
Key Concepts
1. Black-box vs. White-box Models
- Black-box: Complex models (e.g., deep neural networks, ensemble methods) whose internal logic is not directly interpretable
- White-box: Simple models (e.g., decision trees, linear regression) with inherent interpretability
2. Global vs. Local Explanations
- Global: Overall understanding of model behavior
- Local: Explanation of a specific prediction for an individual instance
Popular Tools & Techniques
| Tool | Description | Use Case |
|---|---|---|
| LIME | Local interpretable model-agnostic explanations | Interpreting individual predictions |
| SHAP | SHapley Additive exPlanations based on game theory | Feature importance globally and locally |
| ELI5 | Unified interface for several explainability techniques | Debugging classifiers |
| What-If Tool (WIT) | TensorBoard plugin for model inspection | Visual exploration of model behavior |
| InterpretML | Microsoft library with glassbox and blackbox interpretability methods | Ensemble model explanation |
Integration Steps (Sample - SHAP)
import shap
import xgboost
from sklearn.model_selection import train_test_split

# Train a model
X_train, X_test, y_train, y_test = train_test_split(X, y, test_size=0.2)
model = xgboost.XGBClassifier().fit(X_train, y_train)

# Explain predictions
explainer = shap.Explainer(model)
shap_values = explainer(X_test)
shap.summary_plot(shap_values, X_test)
Understanding SHAP and LIME
Understanding why a machine learning model makes certain predictions is critical for building trust, debugging, and ensuring fairness. SHAP (SHapley Additive exPlanations) and LIME (Local Interpretable Model-agnostic Explanations) are two popular tools for model explainability.
What is SHAP?
- Based on cooperative game theory, particularly Shapley values
- Assigns each feature an importance value for a particular prediction
- Ensures consistency and local accuracy
- Works with a variety of models: tree-based models, deep learning, linear models, etc.
SHAP Usage Example (with XGBoost)
import shap
import xgboost
import pandas as pd

# Train model
X, y = shap.datasets.boston()
model = xgboost.XGBRegressor().fit(X, y)

# Explain predictions
explainer = shap.Explainer(model, X)
shap_values = explainer(X)

# Visualization
shap.summary_plot(shap_values, X)
What is LIME?
- Approximates the model locally using interpretable models like linear regression
- Perturbs the input data and observes how predictions change
- Generates human-understandable explanations for individual predictions
LIME Usage Example (with scikit-learn)
from lime.lime_tabular import LimeTabularExplainer
from sklearn.ensemble import RandomForestClassifier
from sklearn.datasets import load_iris

# Train model
data = load_iris()
X, y = data.data, data.target
model = RandomForestClassifier().fit(X, y)

# Explain prediction
explainer = LimeTabularExplainer(X,
    feature_names=data.feature_names,
    class_names=data.target_names,
    discretize_continuous=True)
exp = explainer.explain_instance(X[0],
    model.predict_proba, num_features=4)
exp.show_in_notebook()
Key Differences
| Feature | SHAP | LIME |
|---|---|---|
| Theoretical Guarantee | Yes (Shapley values) | No |
| Global Explanations | Yes | Limited |
| Local Explanations | Yes | Yes |
| Computation Time | Higher | Lower |
| Model Agnostic | Yes (and model-specific too) | Yes |
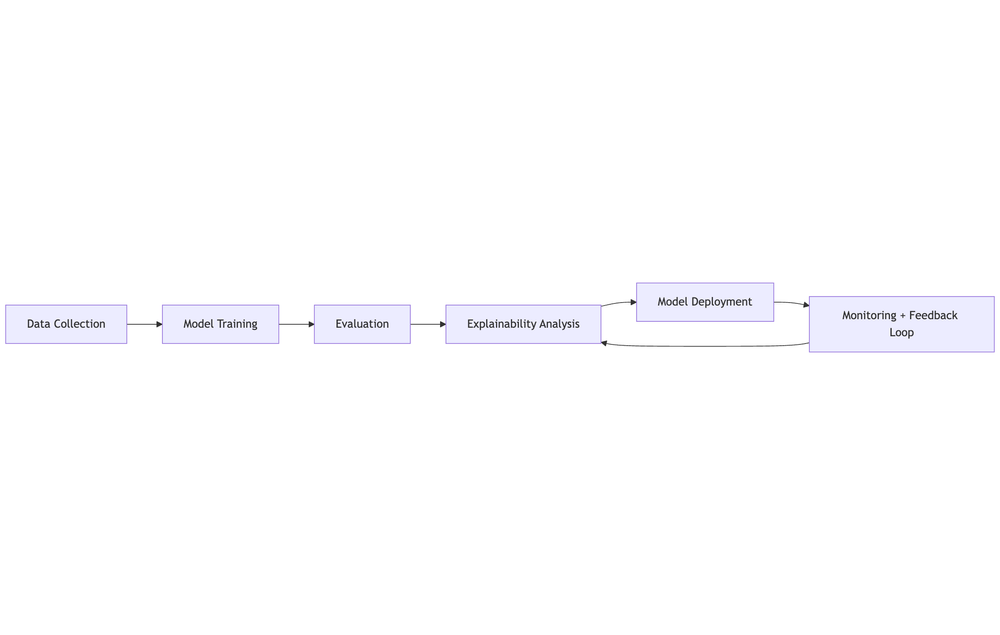
Integrating Explainable AI (XAI) in Production
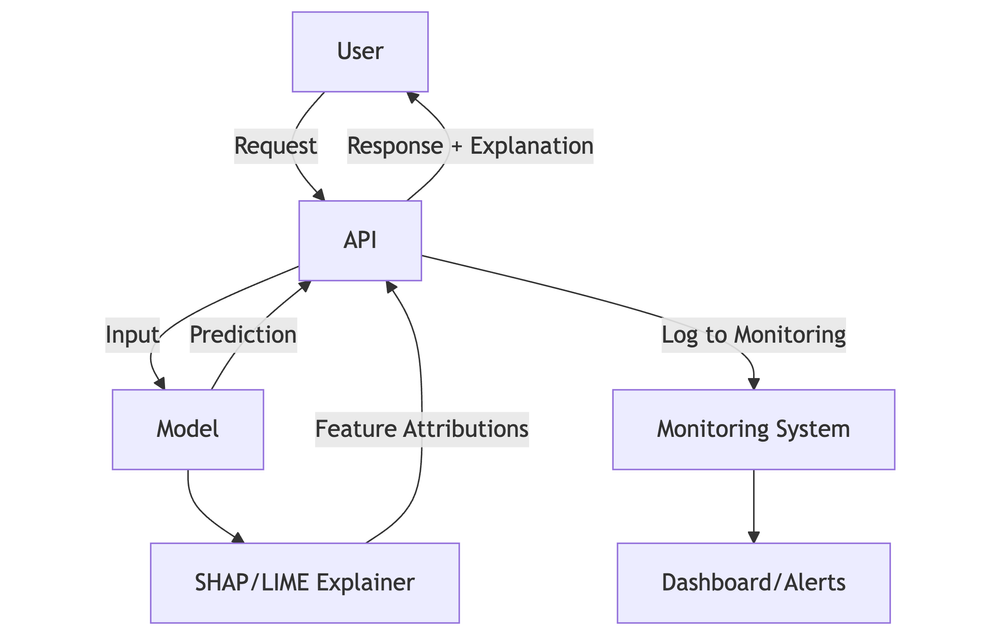
As ML models are increasingly deployed in real-world applications, integrating explainability directly into production systems (APIs, dashboards, and monitoring flows) is becoming essential.
Why Integrate XAI in Production?
- Transparency for Users: Help end-users understand why decisions were made
- Debugging & Monitoring: Detect anomalies or drift in model behavior
- Compliance: Meet regulatory requirements (e.g., GDPR, HIPAA)
- Trust: Build trust with stakeholders through interpretable AI systems
Common Integration Patterns
1. Real-time API Explanations
Embed SHAP or LIME outputs in API responses:
{
  "prediction": "Approved",
  "explanation": {
    "income": 0.35,
    "credit_score": 0.25,
    "loan_amount": -0.20
  }
}
Example: FastAPI with SHAP
from fastapi import FastAPI, Request
import shap
import xgboost
import pandas as pd

app = FastAPI()

X, y = shap.datasets.boston()
model = xgboost.XGBRegressor().fit(X, y)
explainer = shap.Explainer(model, X)

@app.post("/predict")
async def predict(request: Request):
    input_data = await request.json()
    df = pd.DataFrame([input_data])
    prediction = model.predict(df)[0]
    shap_values = explainer(df)
    explanation = dict(zip(df.columns, shap_values.values[0]))
    return {"prediction": prediction, "explanation": explanation}
2. Interactive Dashboards
- Use tools like Plotly Dash, Streamlit, or Grafana to visualize SHAP/LIME outputs
- Enable feature importance heatmaps, local/global explanation views
- Connect to model monitoring tools (e.g., Prometheus, EvidentlyAI)
Example: Streamlit with SHAP
import streamlit as st
import shap
import xgboost
import pandas as pd

X, y = shap.datasets.boston()
model = xgboost.XGBRegressor().fit(X, y)
explainer = shap.Explainer(model, X)

st.title("SHAP Dashboard")
input_idx = st.slider("Select Index", 0, len(X)-1)
shap_values = explainer(X)
shap.plots.waterfall(shap_values[input_idx])
Model Interpretability in Real-World ML Deployments
Model interpretability is the degree to which a human can understand the cause of a decision made by a machine learning system. In real-world deployments, interpretability becomes essential not only for technical validation but also for legal, ethical, and operational reasons.
Why Interpretability Matters
1. Trust and Adoption
- Stakeholders and users are more likely to adopt ML systems they understand
- Black-box models can be rejected in high-stakes applications (e.g., healthcare, finance)
2. Debugging and Model Validation
- Helps data scientists and engineers verify whether the model logic aligns with domain knowledge
- Identify and correct data leakage, spurious correlations, or label noise
3. Compliance and Regulation
- Laws like GDPR, HIPAA, and upcoming AI legislation mandate explainability
- Organizations must demonstrate the logic behind automated decisions
4. Fairness and Bias Detection
- Interpretability reveals if sensitive attributes (e.g., race, gender) are influencing outcomes
- Supports responsible AI initiatives
5. Operational Monitoring
- Explanation patterns can be used to monitor drift or degraded performance in real time
Common Techniques
| Technique | Description | Tools |
|---|---|---|
| SHAP | Shapley values for feature attribution | SHAP |
| LIME | Local linear approximation | LIME |
| Partial Dependence | Show marginal effect of features | scikit-learn, SHAP |
| Counterfactuals | What-if analysis | Alibi, DiCE |
| Saliency Maps | Visual attention in CNNs | Captum, tf-explain |
Supporting Compliance, Debugging, and Trust
⚖️ Compliance
- Regulatory bodies like GDPR, HIPAA, and the AI Act require transparency in automated decision systems
- Organizations must provide "meaningful information about the logic involved" in automated decisions
- SHAP/LIME provide per-decision explanations
- Log and expose feature attribution data via API/dashboards
🔍 Debugging
- Models may behave unexpectedly in edge cases or under data drift
- Understanding why a prediction was made helps resolve errors faster
- Use local explanations to debug misclassified samples
- Identify features causing instability or drift
🤝 Building User Trust
- Users need to understand model decisions—especially in sensitive domains (healthcare, finance, hiring)
- Trust increases adoption and satisfaction
- Show why a recommendation or decision was made
- Let users explore what-if scenarios (e.g., "What if my income were higher?")
- Provide actionable insights to improve outcomes
🧠 Best Practices
- Cache frequent SHAP values to reduce compute cost
- For LIME, limit explanation calls or use sampling
- Normalize explanation outputs for consistent UX
- Perform PII redaction before logging any input/explanation
Tools & Frameworks
| Tool | Use Case | Model Compatibility |
|---|---|---|
| SHAP | Compliance, Debugging, Trust | Tree, linear, deep models |
| LIME | Debugging, Trust | Model agnostic |
| Captum | Debugging (PyTorch) | PyTorch |
| EvidentlyAI | Monitoring & drift detection | Model agnostic |
| Fiddler / Arize AI / WhyLabs | Enterprise-grade XAI + monitoring | Platform-based |
🔥 Challenges
Basic Explanations
- Use SHAP to generate a summary plot (global feature importances)
- Use SHAP or LIME to explain at least 3 individual predictions
- Compare explanations across correct and incorrect predictions
Integrate with API
- Modify your FastAPI/Flask model endpoint to include an optional
explain=trueflag - When set, return the top 3 feature importances alongside the prediction
Dashboard / Visualization
- Create a simple Streamlit or Dash app to visualize SHAP values
- Package this app in Docker
Production Considerations
- Add rate limiting or access control to your XAI endpoint (if in production)
- Save SHAP values and plots as part of the model logs for future audits
- Compare interpretability results across two different model types (e.g., XGBoost vs. Random Forest)